Mass Spectrometry for Peptide Identity: ESI, MALDI and What the Peaks Mean
HPLC says how pure a sample is; mass spectrometry says what it is. A guide to ESI and MALDI spectra, charge states, deconvolution and mass tolerance on a peptide COA.
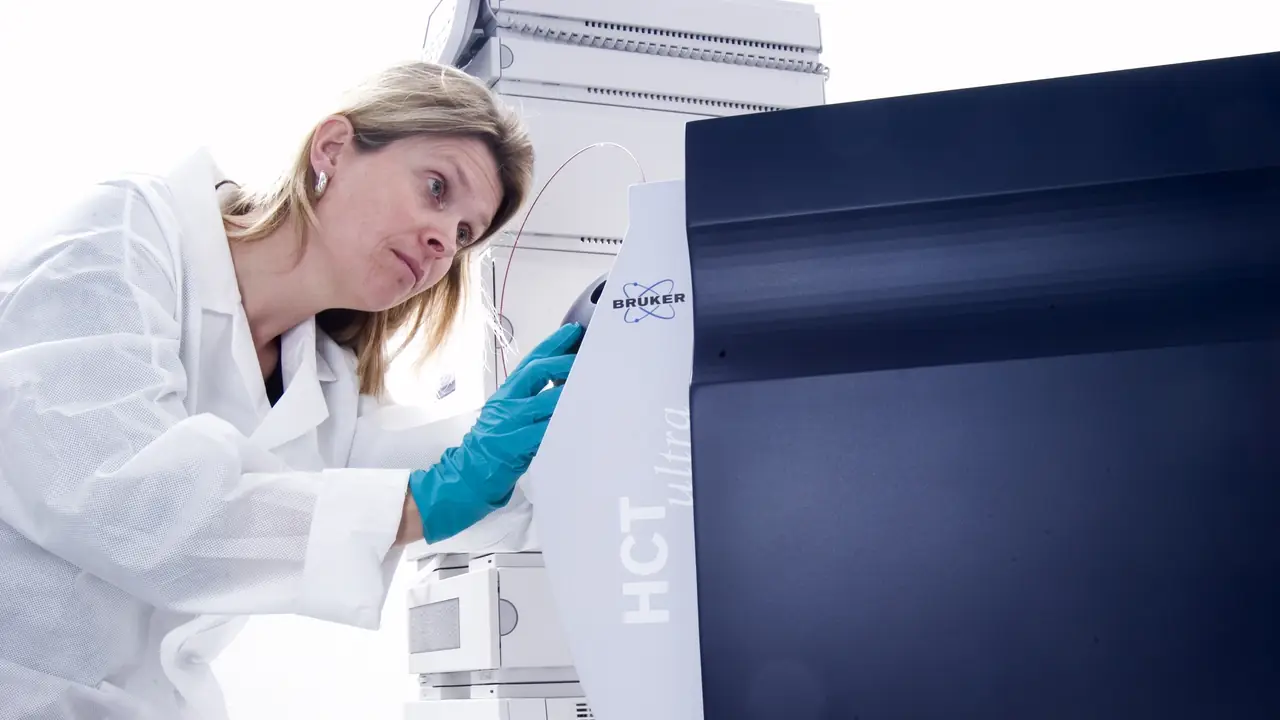
Purity and identity are different questions. A sample can be 99% pure and still be the wrong peptide. Mass spectrometry (MS) is how a laboratory confirms that the molecule in the vial has the molecular weight its sequence predicts.
The principle in one paragraph
A mass spectrometer turns molecules into gas-phase ions, separates them by their mass-to-charge ratio (m/z) and counts them. Peptides are usually ionised by adding protons, so a peptide of mass M carrying n extra protons appears at roughly (M + n) ÷ n. The instrument reports a spectrum: m/z on the x-axis, signal intensity on the y-axis.
ESI: many peaks, one molecule
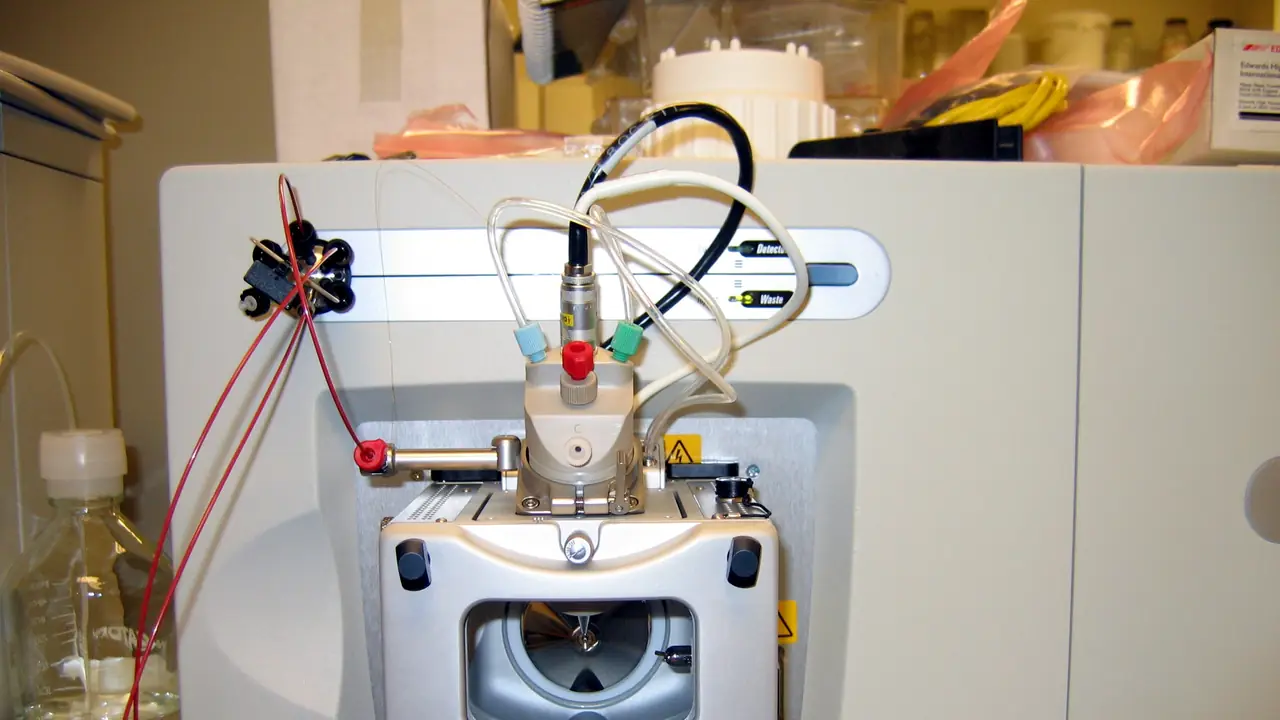
Electrospray ionisation (ESI) sprays the dissolved sample through a charged needle. Larger peptides pick up several protons, so one molecule appears as a series of peaks: [M+2H]²⁺, [M+3H]³⁺, [M+4H]⁴⁺. Software deconvolutes that envelope back to a single neutral mass.
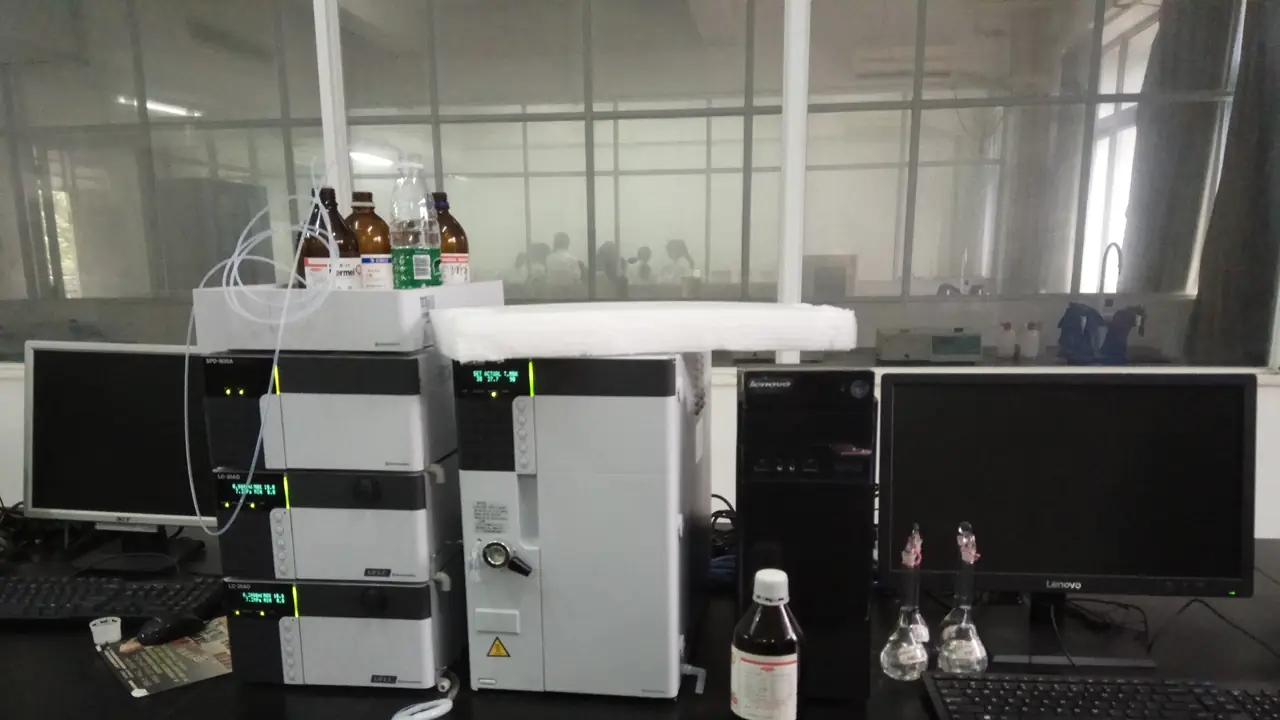
ESI is often coupled directly to HPLC (LC-MS). That gives a mass for the main chromatographic peak specifically, and often for the impurity peaks next to it, which is very useful for identifying deletion sequences or oxidation products.
MALDI-TOF: usually one peak
Matrix-assisted laser desorption/ionisation (MALDI) co-crystallises the sample with a matrix and fires a laser at it. Peptides mostly pick up a single proton, so the spectrum shows a dominant [M+H]⁺ peak, sometimes with sodium [M+Na]⁺ and potassium [M+K]⁺ adducts 22 and 38 Da higher. A time-of-flight (TOF) analyser measures m/z from how long ions take to reach the detector.
What to check on the certificate
| Item | What good looks like |
|---|---|
| Theoretical mass | Calculated from the sequence, stated as monoisotopic or average |
| Observed mass | Within the instrument’s stated tolerance of the theoretical value |
| Spectrum image | Present, with the main peak labelled |
| Method | ESI or MALDI, instrument type, mode |
Be clear on monoisotopic vs average mass. The monoisotopic mass uses the most abundant isotope of each element; the average mass weights all isotopes. For a 4–5 kDa peptide they differ by a few daltons, so a report must compare like with like.
Common modifications you can spot by mass
- +16 Da: oxidation, typically methionine or tryptophan
- +1 Da: deamidation of asparagine or glutamine (subtle; needs good resolution)
- −17 or −18 Da: pyroglutamate formation from N-terminal Gln or Glu
- +114 Da (TFA), +22 Da (Na): adducts, not impurities in the vial
Identity plus purity
MS confirms what the molecule is; HPLC quantifies how much of the sample it is. A complete COA has both. For the purity side, read HPLC purity explained; for the certificate as a whole, see how to read a peptide COA.
For in-vitro laboratory research only. Not for human or veterinary use. This article summarises laboratory practice and published research. Nothing here is advice about use in people or animals.