HPLC and Mass Spectrometry: How Research Peptides Are Tested
How research peptides are tested: RP-HPLC purity, LC-MS and MALDI identity, and the extra tests (net content, water, counter-ions, endotoxin) behind a full COA.
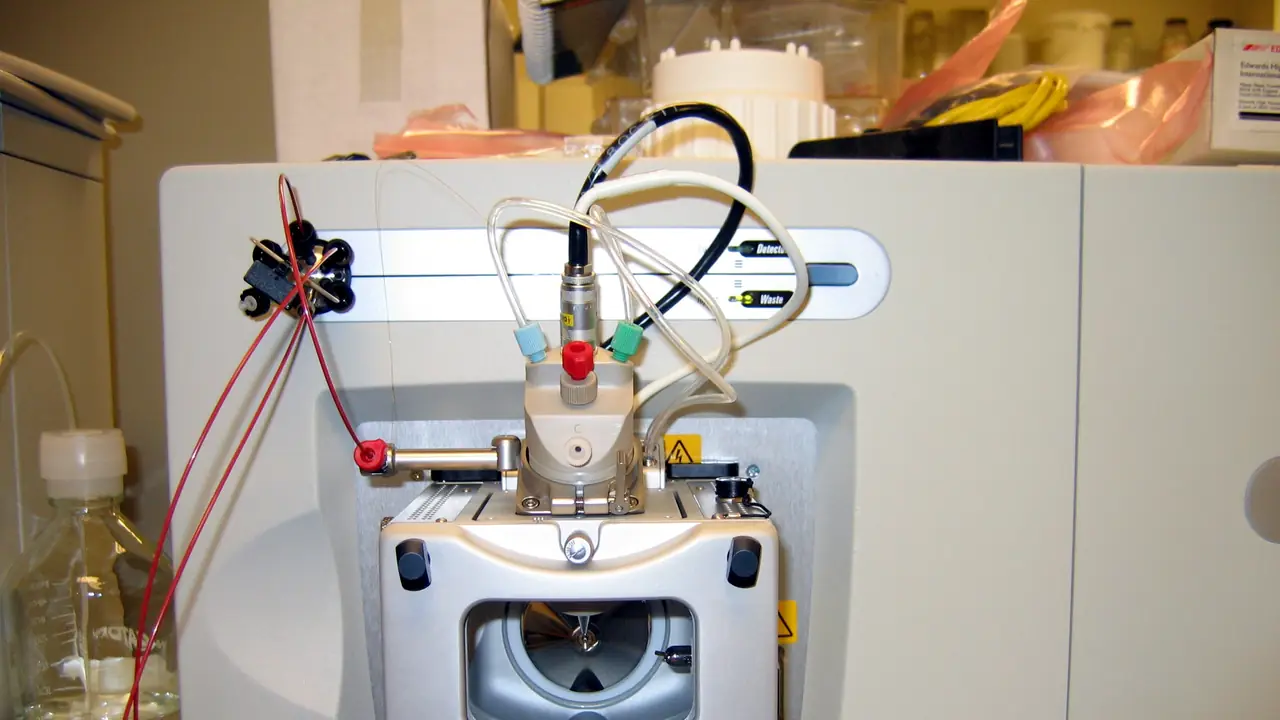
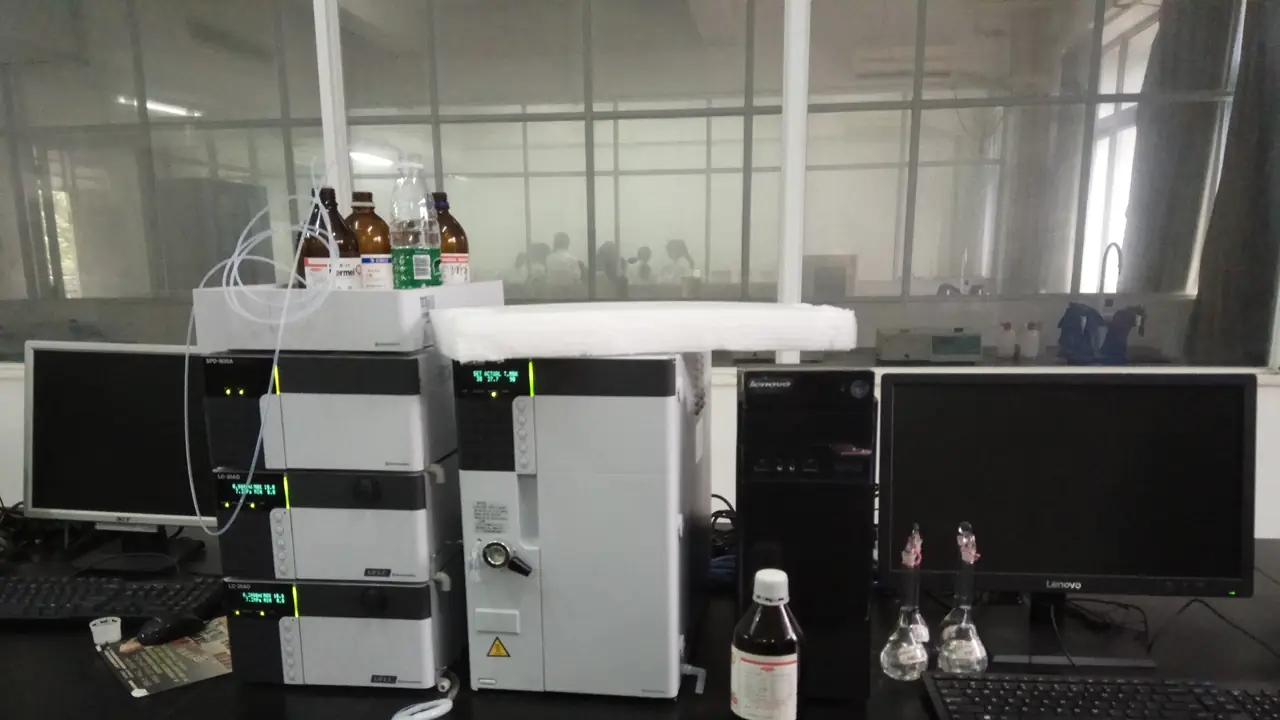
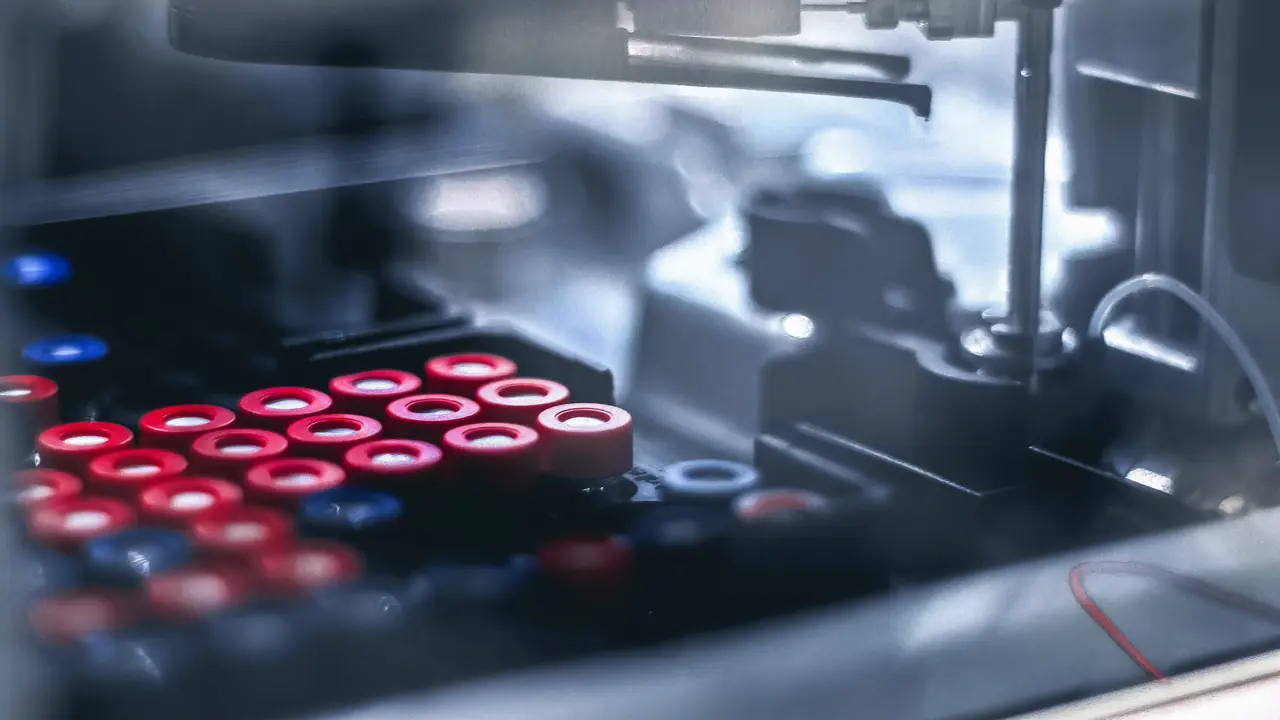
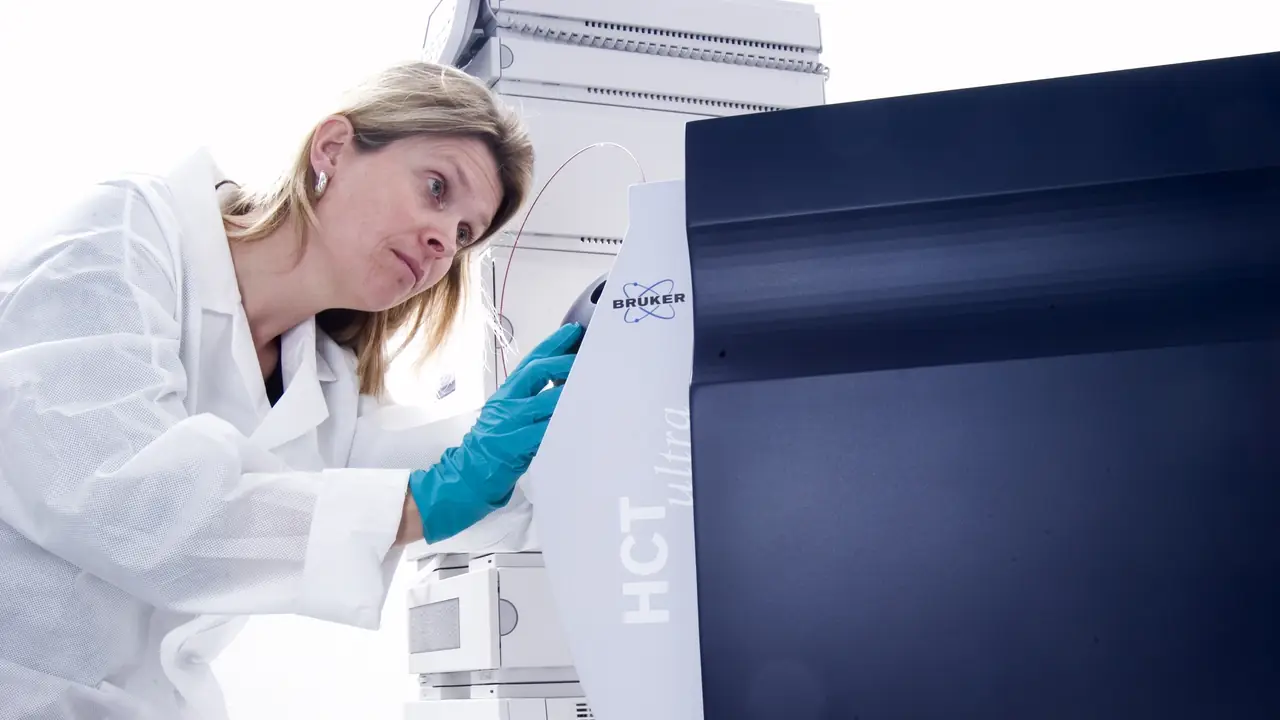
Two instruments do most of the work behind a research peptide certificate of analysis: high-performance liquid chromatography (HPLC), which measures purity, and mass spectrometry (MS), which confirms identity. They answer different questions, fail in different ways, and are strongest together. This guide explains how each method works, what a well-documented result looks like, and which additional tests complete the picture.
Key point: HPLC answers “how much of the UV-absorbing material is the target peptide?”. Mass spectrometry answers “is the main component the right molecule?”. A COA that reports only one of the two leaves half the question open.
For a single-topic deep dive, see HPLC purity explained and mass spectrometry for peptide identity. This article ties them together as one testing workflow.
Reversed-phase HPLC: the purity method
How it separates a peptide sample
Almost all peptide purity testing uses reversed-phase HPLC (RP-HPLC). The sample is loaded onto a column packed with hydrophobic particles, usually C18 (octadecyl-bonded silica). Two mobile phases are pumped through it:
- Mobile phase A: water with an ion-pairing acid, typically 0.1% trifluoroacetic acid (TFA).
- Mobile phase B: acetonitrile with the same acid.
A gradient raises the proportion of B over time (for example 5% to 65% B over 20–30 minutes). Each component of the sample leaves the column at a characteristic retention time depending on its hydrophobicity. The target peptide, truncated sequences, deletion sequences, oxidised forms and residual protecting-group adducts separate into distinct peaks.
How purity is calculated
A UV detector records absorbance as the sample leaves the column. Peptides are usually monitored at 214–220 nm, where the peptide bond absorbs, sometimes alongside 280 nm for aromatic residues. Purity is calculated as area percent: the area of the main peak divided by the total area of all integrated peaks.
That definition has consequences worth knowing:
- Purity is relative to what the detector sees. Water, salts and counter-ions do not absorb at 214 nm and are invisible to the calculation.
- Impurities that co-elute with the main peak are counted as target peptide. A sharper, longer gradient or a second column chemistry reduces that risk.
- Integration settings (baseline placement, minimum peak area) change the result. A report should state them or show the integrated chromatogram.
What a well-documented HPLC result includes
| Item | Why it matters |
|---|---|
| Chromatogram image | Lets you see peak shape, baseline and minor peaks |
| Peak table (retention time, area, area %) | Lets you recompute the purity figure |
| Column and particle size | Defines the separation |
| Mobile phases and gradient | Needed to reproduce the run |
| Detection wavelength | Purity at 214 nm and at 280 nm can differ |
| Blank run | Shows which peaks come from the system, not the sample |
UPLC (ultra-performance LC) uses smaller particles and higher pressures for sharper peaks and faster runs. The principle and the purity calculation are the same.
Mass spectrometry: the identity method
Electrospray ionisation (LC-MS)
In LC-MS, the HPLC column feeds directly into a mass spectrometer through an electrospray ionisation (ESI) source. ESI turns dissolved peptide molecules into gas-phase ions that carry several protons each, so a single peptide appears as a series of peaks at different mass-to-charge ratios (m/z):
- [M+2H]²⁺ appears at (M + 2 × 1.007) / 2
- [M+3H]³⁺ appears at (M + 3 × 1.007) / 3, and so on
Deconvolution software combines the charge-state series back into one neutral mass, which is compared with the theoretical mass calculated from the sequence.
LC-MS methods usually replace TFA with formic acid, because TFA suppresses the electrospray signal. That is why the LC-MS chromatogram on a COA can look slightly different from the UV purity trace: the separation conditions are not identical.
MALDI-TOF
Matrix-assisted laser desorption/ionisation (MALDI) mixes the sample with a UV-absorbing matrix and fires a laser at it. Ions are mostly singly charged ([M+H]⁺), so the spectrum is simpler to read: one main peak near the expected mass. MALDI is fast and tolerant of salts, but it is usually run without a chromatographic separation, so it confirms identity without saying much about purity.
Mass accuracy and what “a match” means
| Instrument class | Typical mass accuracy | What it can confirm |
|---|---|---|
| Single quadrupole, ion trap | About ±0.5–1 Da | Nominal mass of a small peptide |
| MALDI-TOF (linear) | Hundreds of ppm | Approximate mass, larger peptides |
| High-resolution qTOF, Orbitrap | Under about 5 ppm | Monoisotopic mass, isotope pattern |
For small peptides, reports often give the monoisotopic mass. For larger peptides, and on lower-resolution instruments, the average mass is common. A report should say which it uses; comparing a monoisotopic observation with an average theoretical value creates an apparent “error” of a dalton or more for a peptide of a few kilodaltons.
Tandem mass spectrometry (MS/MS) goes further, fragmenting the peptide and reading sequence ions (b and y ions) to confirm the order of residues, not just the total mass. It is the strongest routine identity test, and it is what methods labelled UPLC-MS/MS are doing.
Orthogonal tests that complete a COA
HPLC and MS describe the peptide itself. A lyophilised vial contains other things too. Complete characterisation adds:
- Net peptide content. The fraction of the powder’s weight that is peptide, measured by amino acid analysis or nitrogen (CHN) analysis. Commonly 60–90% for a lyophilised salt. See net peptide content vs purity.
- Water content. Usually by Karl Fischer titration. Lyophilised peptides are hygroscopic, so water can rise after manufacture if vials are opened cold.
- Counter-ion content. Trifluoroacetate or acetate, measured by ion chromatography or ¹⁹F NMR for TFA. See TFA vs acetate.
- Bacterial endotoxin. By the LAL (Limulus amoebocyte lysate) test, reported in endotoxin units (EU) per mg or per vial. It matters most for cell culture; see endotoxin testing for peptides used in cell culture.
- Residual solvents and elemental impurities. By GC and ICP-MS respectively, when a study requires them.
Putting it together: a testing workflow
A rigorous testing sequence for one lot of a research peptide looks like this:
- LC-MS identity. Confirm the main component’s mass matches the sequence.
- RP-HPLC purity. Quantify the main peak as area percent at 214–220 nm, with the chromatogram and peak table.
- Content and composition. Net peptide content, water and counter-ion, so concentrations can be calculated from the true peptide mass.
- Application-specific tests. Endotoxin for cell-based work, MS/MS where sequence confirmation matters.
- Independent confirmation. Repeat the identity and purity tests at a laboratory unconnected to the supplier.
Each result belongs to one lot and one date. Our checklist for verifying a COA covers how to confirm a report is genuine and matches your vial.
How these methods appear on Vial AU certificates
Every certificate in the certificate library states the laboratory, the test type and the test date, and names the lot it covers. Purity results are HPLC area-percent figures, identity is confirmed by mass spectrometry, and selected lots also carry bacterial endotoxin reports. Independent laboratory reports are labelled with the laboratory’s name, and supplier batch reports are labelled “Supplier lab”.
Frequently asked questions
Why does a peptide need both HPLC and mass spectrometry?
HPLC measures how much of the sample is the main component but cannot say what that component is. Mass spectrometry confirms the main component’s identity but is not a reliable purity measure on its own. Together they show that the right molecule is present and how pure it is.
Is 99% HPLC purity the same as 99% peptide content?
No. HPLC purity is the share of UV-absorbing material that is the target peptide. Net peptide content is the share of the vial’s total weight that is peptide, after water and counter-ions. A 99% pure peptide often has a net content between 60% and 90%.
What wavelength should peptide HPLC purity be measured at?
Most methods use 214 or 220 nm, where the peptide bond absorbs strongly. Results at 280 nm only detect residues with aromatic side chains and can overstate or understate purity, so the wavelength should always be stated on the report.
What is UPLC-MS/MS?
UPLC-MS/MS combines ultra-performance liquid chromatography with tandem mass spectrometry. It separates the sample like HPLC, then fragments the peptide to confirm its sequence, giving both a purity profile and a sequence-level identity check.
For in-vitro laboratory research only. Not for human or veterinary use.
For in-vitro laboratory research only. Not for human or veterinary use. This article summarises laboratory practice and published research. Nothing here is advice about use in people or animals.