HPLC Purity Explained: What “99%+ Purity” Actually Measures
Reversed-phase HPLC is the standard purity test for research peptides. Here is how the number is produced, what the chromatogram shows and where the method's limits are.
“99% purity” is the most quoted figure in peptide supply and one of the least understood. It is a real, useful measurement, but a specific one: it comes from reversed-phase high-performance liquid chromatography (RP-HPLC) with UV detection, and it measures relative peak area, not mass.
How the separation works
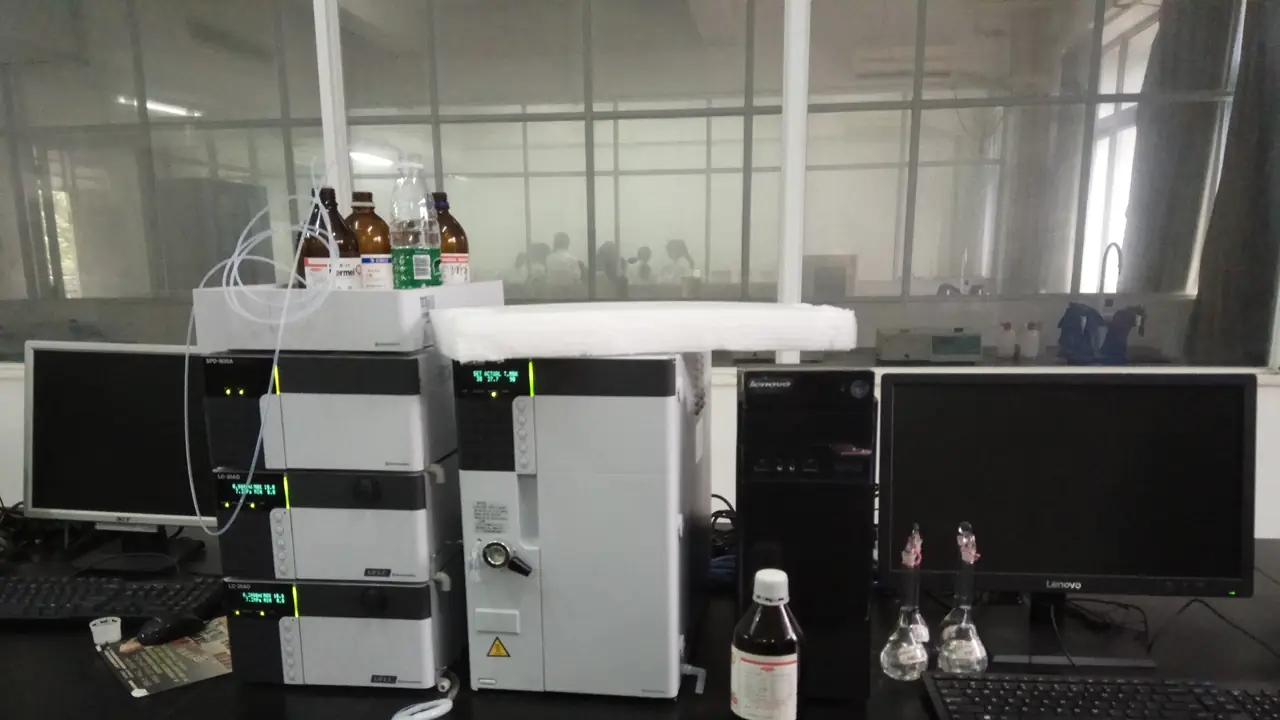
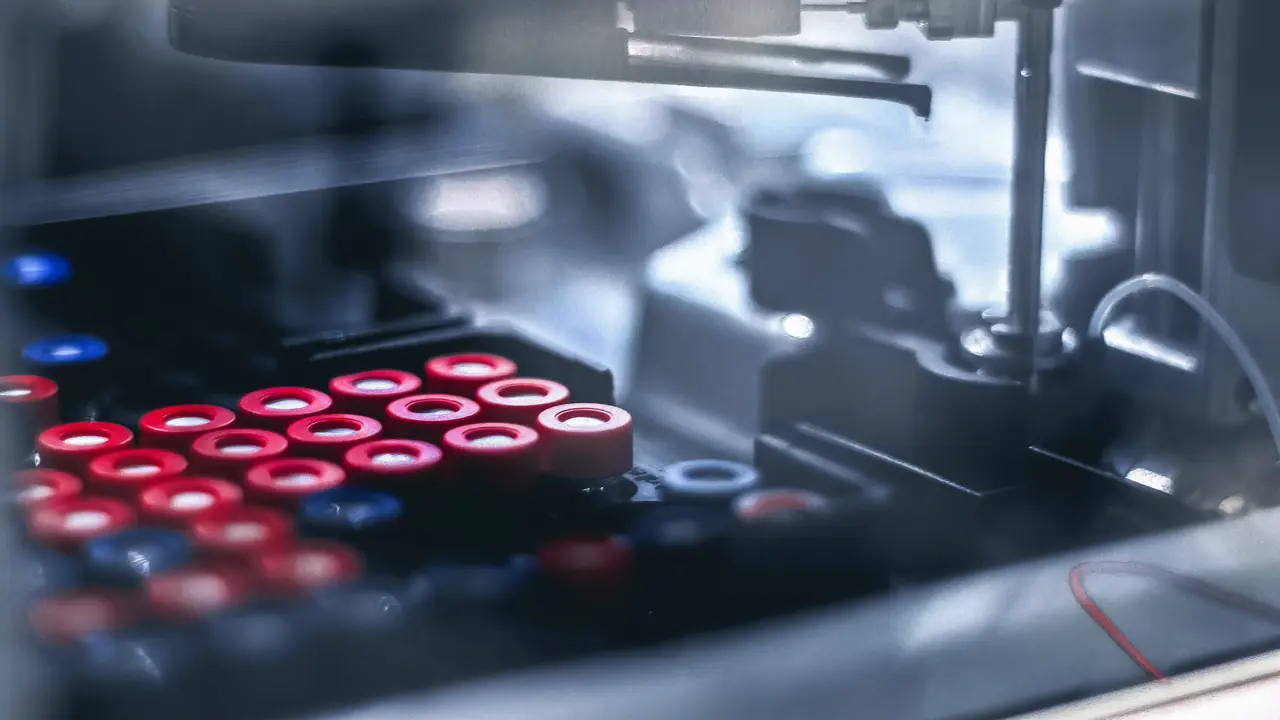
A small volume of dissolved peptide is loaded by the autosampler onto a column packed with silica beads coated in C18 hydrocarbon chains. Two solvents are pumped through:
- Mobile phase A: water with about 0.1% trifluoroacetic acid (TFA)
- Mobile phase B: acetonitrile with about 0.1% TFA
The method runs a gradient from mostly A to mostly B. Hydrophilic species leave the column early; hydrophobic ones stick to the C18 chains and elute later. Closely related impurities, such as a peptide missing one amino acid (a deletion sequence) or carrying an oxidised methionine, usually elute just before or after the main peak.
How the number is calculated
A UV detector set at 214–220 nm watches the column outlet. At those wavelengths the peptide bond itself absorbs, so nearly every peptide-related species gives a signal. The software integrates the area under each peak:
Purity (%) = area of main peak ÷ total area of all integrated peaks × 100
That is why the chromatogram matters. You can see whether the baseline is flat, whether small peaks were integrated or ignored, and whether the main peak is sharp and symmetrical or has a shoulder hiding a co-eluting impurity.
What HPLC purity does not tell you
| HPLC purity is | HPLC purity is not |
|---|---|
| The share of UV-absorbing material that is the main peak | The share of the vial’s mass that is peptide |
| Specific to one method (column, gradient, wavelength) | Directly comparable across labs using different methods |
| Good at catching deletion and truncated sequences | Proof of identity (that needs mass spectrometry) |
| Blind to water and most counter-ions | A measure of salt or moisture content |
A peptide can be 99% pure by HPLC and still be only about 75% peptide by mass, because counter-ions and water do not absorb at 214 nm. Our article on net peptide content covers that gap.
Reading a chromatogram in practice
- Find the main peak. It should dominate. Note its retention time.
- Look either side. Small peaks close to the main one are usually related impurities. Peaks at the very start are often solvent or salt front.
- Check the integration marks. Every peak counted should be marked. A report that integrates only the main peak will always read close to 100%.
- Check the method box. Column, gradient, flow rate and wavelength should be stated.
Why two labs can disagree
A shallow gradient on a high-resolution column separates impurities that a fast gradient merges into the main peak. Two honest labs can therefore report 98.6% and 99.4% for the same lot. Small differences are expected; large ones deserve a look at both chromatograms.
For identity confirmation alongside purity, read mass spectrometry for peptide identity. For what to check on the rest of the certificate, see how to read a peptide COA.
For in-vitro laboratory research only. Not for human or veterinary use. This article summarises laboratory practice and published research. Nothing here is advice about use in people or animals.