Designing Multi-Compound Experiments: Factorial Layouts, Concentration Ranges and Synergy
How to design in-vitro experiments that combine two or more peptides: factorial designs, concentration-response matrices, additivity models, plate layout and replication.
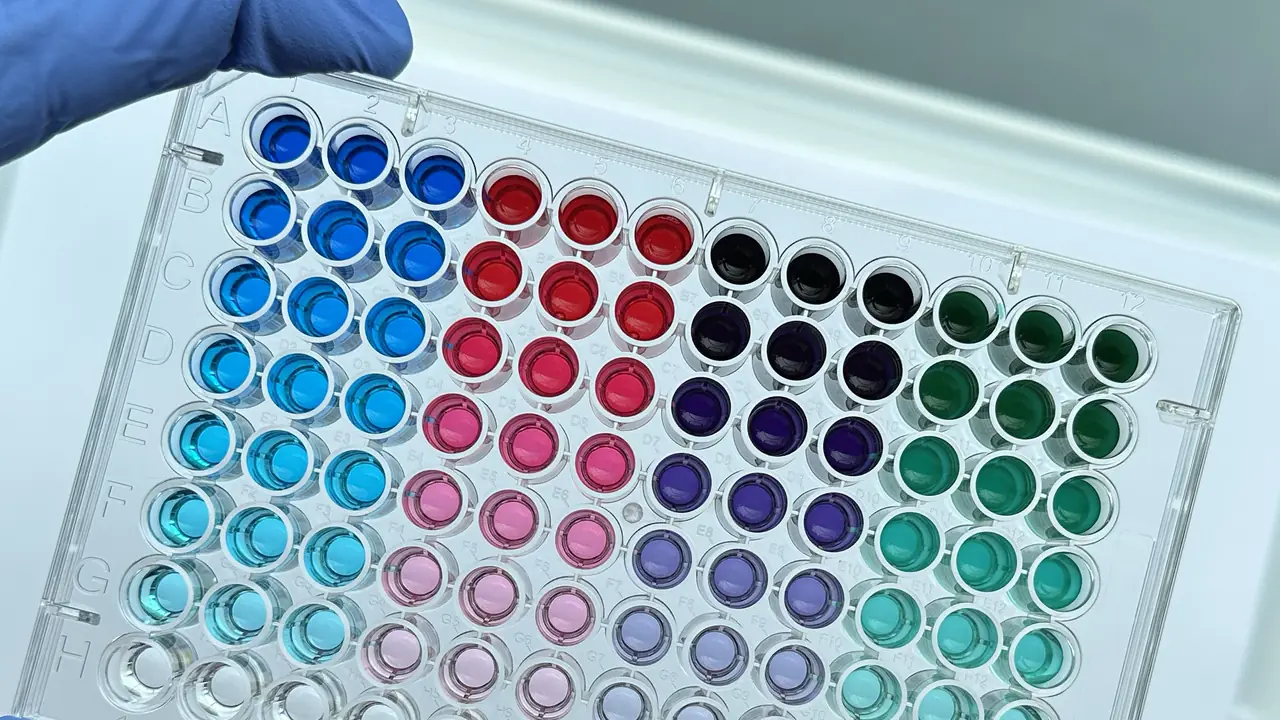
Combining compounds multiplies the number of conditions quickly, and with it the ways an experiment can mislead. A few design principles keep combination studies interpretable and reproducible.
Start with the question
- “Does B change the effect of A?” needs A alone, B alone and A + B, each against vehicle.
- “Is the combination synergistic?” needs full concentration ranges of each compound, alone and combined, plus an additivity model.
- “Which of several compounds is most active?” is a screen: a single concentration (or two) per compound, many compounds, strong controls.
The 2 × 2 factorial design
The simplest combination experiment has four arms: vehicle, A, B and A + B. Analysed with a two-way ANOVA, it tells you whether each compound has an effect and whether there is an interaction, meaning the combined effect differs from the sum of the individual effects.
Concentration-response matrices
Single concentrations can hide everything interesting. For synergy work, test each compound across a range (often 6–8 half-log steps) and combine them in a checkerboard matrix: compound B across columns, compound A down rows.
| A ↓ · B → | B: 0 | B: low | B: mid | B: high |
|---|---|---|---|---|
| A: 0 | Vehicle | B alone | B alone | B alone |
| A: low | A alone | A + B | A + B | A + B |
| A: mid | A alone | A + B | A + B | A + B |
| A: high | A alone | A + B | A + B | A + B |
Defining “more than additive”
There is no single definition of synergy. The two most used reference models are:
- Bliss independence: assumes the compounds act through independent mechanisms; the expected combined fractional effect is E_A + E_B − E_A × E_B.
- Loewe additivity: assumes the compounds behave like dilutions of each other; tested with isobolograms and the combination index.
Choose the model that fits what you know about the mechanisms, and state it in the methods.
Plate layout and bias
- Avoid edge wells for test conditions, or fill them with medium; evaporation makes outer wells behave differently.
- Randomise or counterbalance the position of conditions across the plate.
- Replicate properly: technical replicates (wells) estimate pipetting noise; biological replicates (independent cultures on different days) estimate real variability.
- Blind the analysis where readouts involve judgement, such as scoring images.
Concentrations and records
- Correct stock concentrations for net peptide content (net peptide content vs purity); the concentration calculator handles mg/mL to µM.
- Keep the final solvent concentration identical across every well, including vehicle.
- Record the lot code of every compound against the plate map (lot numbers and batch traceability).
For the reasoning behind specific pairings, see research stacks explained.
For in-vitro laboratory research only. Not for human or veterinary use. This article summarises laboratory practice and published research. Nothing here is advice about use in people or animals.